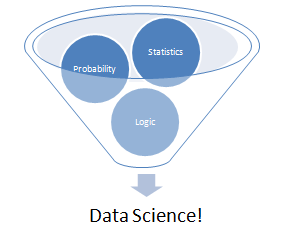
In a previous article I provided a list of R programming resources. As a complement to that post, I’ve compiled a list of statistically oriented websites that colleagues and I have found useful below. For the most part, these sites focus on statistics and quantitative research methods rather than programming.
Positioning charts with fig and fin
R offers several ways to spatially orient multiple graphs in a single graphing space. The layout() function and mfrow/mfcol parameter settings are adequate solutions for many tasks and allow the graphing space to be broken up into tabular or matrix-based arrangements. For more fine grained manipulation, the fig and fin parameter settings are available. This […]
Online R programming resources
R can legitimately be called both a programming language and a statistical package. Many books address both the programming and statistical components of R, but invariably the discussion of statistical topics is more detailed than the discussion of programming capabilities. As a supplement, I’ve started the list of links below. Each of these sources deals […]
Controlling margins and axes with oma and mgp
When creating graphs, we’re usually most concerned with what happens near the center of our displays, as this is where most of the important information is generally held. But sometimes, either for aesthetics or clarity, we want to adjust what’s outside of the box – in the margins, labels or tick marks. The par() function […]

